Eskom Data Portal · Actual Generation · May 2025 – May 2026
Open Cycle Gas Turbine (OCGT) Generation
Eskom OCGT + Dispatchable IPP OCGT · Hourly actual dispatch · Last 12 months
1,567 GWhTotal OCGT energy generated (Eskom + IPP, 12 months)
462 GWhEskom OCGT only (30% of total)
1,105 GWhIPP OCGT (70% of total)
3,058 MWPeak combined dispatch 7 Jul 2025, 20:00
0.74%Avg OCGT as % of residual demand (12m)
Key finding: Eskom OCGT was dispatched heavily in May–Jul 2025 (winter onset, 397 GWh across 3 months) then almost completely stood down from August 2025 onwards — dropping to near-zero from Aug 2025 through Feb 2026. IPP OCGT ran continuously throughout at a near-constant ~100 MW baseload, suggesting a contracted minimum dispatch obligation. Eskom OCGT has resumed modest dispatch from March 2026 as winter approaches again.
Data: Eskom Data Portal historical download (Apr 2022–May 2026) · OCGT columns: “Eskom OCGT Generation” and “Dispatchable IPP OCGT” · Each row represents one hourly interval · MW values are average sent-out generation for that hour · GWh calculated as sum of hourly MW / 1000
Flattening the Curve — What Every Solar Installer Needs to Know
Technical Guidance · Solar PV Installers
You Installed the Panels. Now Flatten the Curve.
South Africa’s grid load profile reveals a clear daily pattern of stress and relief.
This article describes that problem — and one approach to addressing it.
The principles are universal. The execution will vary by site, inverter platform, and client.
Based on Eskom Actual Residual Demand data · Apr 2022 – May 2026 · Weekday averages
29.3 GWWinter evening peak demand (18:00 average)
3.6 GWSeasonal peak gap winter vs. summer
~5 GWEmbedded rooftop solar installed nationally
What the Load Curve Is Telling Us
The interactive chart below is not just a technical diagram. It is a map of exactly when South Africa’s
electricity infrastructure is under stress — and by extension, when every poorly configured solar system
on the grid is making things worse rather than better.
Two features of the curve demand attention from anyone who installs rooftop solar and battery systems.
Use the controls to toggle between seasons and explore how the TOU tariff bands align with the actual
demand peaks.
Interactive · Eskom National Grid Load Profile · Actual Residual Demand · Apr 2022 – May 2026
Eskom Data Portal · Actual Residual Demand · Weekday averages
Look at the chart above and three things stand out immediately. First, a sharp morning spike
from around 05:00 as the country wakes up — strongest in winter when heating loads stack on
top of the usual morning routine. Second, a midday trough visible in the summer curve between
11:00 and 15:00, the fingerprint of embedded rooftop solar now suppressing grid draw during
peak generation hours. Third, the most severe feature of all: the evening peak, where demand
climbs hard from 16:00 and hits 29.3 GW at 18:00 in winter — at the exact
moment solar generation reaches zero.
These three features define the grid’s daily stress pattern. They are as consistent as the
sunrise. And they are precisely what a correctly configured battery system should be designed
to address.
The Problem: What Most Systems Actually Do
Before describing a possible solution, it is worth being precise about what the problem
actually is — because it is not the hardware. The panels, inverters, and batteries installed
across South Africa are largely capable of far more intelligent behaviour than they are
currently delivering. The problem is the default dispatch pattern that most systems follow
after installation, and the absence of any deliberate strategy to change it.
The dominant pattern among installed solar-plus-battery systems follows a simple and deeply
inadequate cycle:
The Common (Wrong) Dispatch Pattern
Battery discharges after sunset through the evening. Once depleted, the system draws from
the grid through the night and into the morning. Solar charges the battery back up during
the day. Battery reaches 100% by mid-morning and then sits there — fully charged, doing
nothing — until the sun goes down again. Repeat.
On paper this looks reasonable. In practice it means the battery is idle at 100% through the
midday period when it should be absorbing surplus solar generation — and it means the morning
peak, one of the two hardest periods for the grid, is covered entirely by Eskom because the
battery exhausted itself the previous evening and solar hasn’t recovered it yet.
The battery is cycling once per day, serving one peak, and sitting unused through most of the
period when it could be most useful. This is not a grid asset. It is a glorified UPS.
A Possible Solution: The Full-Day Dispatch Model
What follows is one approach to addressing the problem described above. It is not the only
approach, and its execution will depend on the inverter platform, battery capacity, site
load profile, and the client’s priorities. The underlying principles, however, are consistent:
the battery should be cycling in response to the grid’s actual daily stress pattern, not
simply reacting to sunset and sunrise.
The model described here targets two discharge events per day — one at the
morning peak, one at the evening peak — with two corresponding recharge events: a slow
overnight grid charge during the off-peak trough, and a solar midday charge during peak
generation hours. The target state of charge before each discharge is 95%,
with a 40% floor maintained as an emergency reserve that is never drawn into
under normal operation.
On a 10 kWh battery, the usable window of 95% to 40% gives 5.5 kWh per discharge event —
11 kWh of active daily contribution across both events. The specific numbers will differ by
system size and load profile. The principle does not.
The 24-Hour Dispatch Cycle
22:00 – 06:00
🔋
Slow grid charge to 95% SoC
Off-peak period — lowest grid demand of the day. Slow charge rate to avoid adding load spike. System draws steadily through the night.
06:00 – 08:00
⚡
Discharge — morning peak cover
Battery discharges to cover morning loads. No grid draw. Floor: 40% SoC emergency reserve. Grid demand climbs sharply here — the battery absorbs it.
08:00 – 10:00
☀️
Solar ramps up, covers daytime loads
Solar takes over household consumption. Battery at ~40–50% resting. Grid demand is declining — no battery action needed.
10:00 – 15:00
🔋
Solar charges battery back to 95%
Peak generation window. Priority: serve loads → charge battery → export surplus only. Target 95% SoC by 15:00. This is the midday recharge that makes the second daily discharge possible.
Deferred PV charging: Do not start battery charging from solar at first light — allow morning solar (08:00–10:00) to serve loads directly while the battery rests at 40%. Defer bulk PV charging to the midday window when generation is at its strongest. This intentionally deepens the midday demand dip on the grid curve, maximising the embedded solar benefit at exactly the point it is most visible. The battery charges faster and more efficiently at peak irradiance, and the grid sees a more pronounced suppression during the 10:00–15:00 window.
15:00 – 17:00
☀️
Solar covers loads, battery holds at 95%
Battery fully charged and waiting. Solar still generating. Grid demand beginning to climb. Hold battery in reserve for the peak ahead.
17:00 – 20:00
⚡
Discharge — evening peak cover
The critical window. Battery discharges to cover all loads. Zero grid draw. Floor: 40% emergency reserve. This is where the national grid hits 29+ GW — every kWh discharged here is one less Eskom must generate.
20:00 – 22:00
🌙
Grid covers remaining evening loads
Battery at 40% reserve. Grid demand easing. System draws lightly from grid. At 22:00 the overnight charge cycle begins again.
On Overnight Grid Charging
Overnight grid charging is likely the most counterintuitive element of this approach —
and the one most likely to need explanation to both clients and fellow installers.
The principle behind it is worth understanding clearly, because the justification is
not primarily financial.
Between 22:00 and 06:00, national demand drops to its daily low — around 19–21 GW. Generation
capacity is in surplus. Coal stations that cannot be ramped down are running at minimum load.
Pulling a slow, steady charge from the grid at this hour adds almost no marginal stress —
it is absorbing capacity that would otherwise go to waste.
Compare that to the morning peak at 07:00, when demand climbs toward 26 GW and every available
generation unit is running hard. A battery that is still recovering from the previous evening —
drawing from the grid at this moment to recharge — is adding load at exactly the wrong time.
The overnight charge eliminates this entirely.
This Is Not About Cost — It Is About When
The motivation for overnight grid charging is not primarily financial, though on TOU tariffs
the off-peak rate saving is a genuine client benefit. The motivation is grid timing. Charging
slowly through the night at low-demand hours, and discharging at the two daily peaks, is
what active grid participation looks like. A battery configured this way is doing something
useful 24 hours a day — not just for four hours after sunset.
On flat-rate and IBT installations, overnight charging costs the same per kWh as any other
time. There is no financial penalty for the client. The grid benefit is identical. The case
for doing it is purely about responsible system configuration.
The 40% Floor — Always Hold the Reserve
The 40% state of charge floor is not a soft guideline. It is a hard limit that should be
programmed into the inverter’s depth-of-discharge setting and never overridden.
It serves two functions. The first is practical: it preserves genuine emergency capacity.
An unplanned grid outage at 19:30, a client’s medical equipment, a power cut that runs
longer than expected — the 40% reserve is what covers those events without the system
being caught empty. The second is technical: consistent deep discharge below 40% accelerates
battery degradation, particularly in lithium iron phosphate chemistry. Holding the floor
protects the battery investment and maintains usable capacity over its service life.
The usable window — 95% to 40% — represents 55% of nominal capacity per
discharge event. On a 10 kWh battery that is 5.5 kWh. On a 15 kWh system, 8.25 kWh.
Twice daily that is a meaningful and consistent contribution. Do not be tempted to squeeze
the floor lower to extend evening coverage — size the battery correctly instead.
This Applies to Every Installation
The full-day dispatch model described above applies equally to TOU-billed clients and to those
on flat-rate or inclined block tariffs. The grid does not differentiate. The morning peak at
07:00 is just as real for a client paying a flat rate per kWh as for one on Megaflex (TOU). The battery’s
state of charge at that moment has the same effect on grid stress regardless of the bill.
TOU billing provides a financial signal that reinforces good behaviour — cheaper overnight
charging, more expensive peak-hour grid draw — but the underlying configuration logic is
identical. An installer who only applies active dispatch management to TOU clients is doing
a disservice to the majority of their installed base and to the grid they all share.
“The load curve is your configuration brief. It tells you exactly when the grid needs
help. Your client’s tariff structure does not change that — it only changes whether
the client notices the benefit on their electricity bill.”
Principles for Implementation
The following points describe what a system configured along these lines should achieve,
and the considerations relevant to each phase of the daily cycle. How each is implemented
will depend on the inverter platform and its scheduling capabilities — the intent here
is to describe the desired outcome and the reasoning behind it, not to prescribe
specific menu paths or parameter values.
The intent is to enter the morning peak with a full battery, charged during the
period of lowest national demand. The charge rate should be spread across the available
window rather than concentrated at the start — a slow, steady draw is what makes this
benign to the grid. On most platforms this means setting a charge current that would
fill an empty battery over six to eight hours, not two. The specific current value
depends on battery capacity and inverter capability.
2
Morning Discharge — Battery as Primary Source, 40% Floor
During the morning peak the battery should be the primary source, with grid draw
minimised or eliminated until either the 40% floor is reached or solar generation
takes over. The 40% floor should ideally be enforced at the inverter firmware level
rather than purely as a schedule parameter — this ensures the floor is respected
regardless of what the schedule is doing. On most winter mornings solar will not be
generating meaningfully until well after the peak begins, so the battery carries
the full load for this period.
3
Midday Solar Charge — Battery Before Export, Deferred Start
During peak solar hours the charge priority should be: serve loads → charge
battery to 95% → export only the genuine surplus. This is the setting that enables
the second daily discharge event — without it, the battery arrives at the evening
peak partially charged. Most factory defaults favour export over charging; this
behaviour should be explicitly reviewed and changed where necessary.
The solar charge should be deferred — not
started at first light. Between early morning and approximately 10:00, solar should
serve loads directly while the battery rests at its morning floor. Starting the bulk
charge when irradiance is approaching its daily peak means faster charging, better
panel efficiency, and — across the installed base — a more pronounced midday demand
dip on the national grid curve. How this deferral is implemented depends on the
inverter platform: some support a self-consumption period type that achieves it
natively; others require a charge current limit or a scheduled block.
4
Evening Discharge — Battery as Primary Source Through the Peak
The evening peak is the critical window — the highest national demand period of
the day. The battery should be the sole source through this period, with grid draw
suppressed and export disabled. The same 40% floor applies. In winter this window
runs broadly from 17:00 to 20:00; in summer the peak shifts later, broadly 18:00
to 21:00. Both seasonal variants should be considered at commissioning and documented
clearly. If battery capacity is insufficient to maintain the floor through a typical
winter evening peak, that is a design conversation, not a configuration adjustment.
5
Geyser and Large Loads — Out of Both Peak Windows
The geyser is typically the largest controllable load on a residential installation.
Running it inside either peak discharge window forces the battery to cover it at the
expense of other loads, or draws from the grid at the worst possible moment. Scheduling
it during solar midday or deep overnight off-peak removes it from the battery’s discharge
burden entirely. The same principle applies to any other large schedulable load —
pool pumps, underfloor heating, EV charging. The specific scheduling method will depend
on what controllable switching is available on site.
6
Seasonal Variation — Summer and Winter Profiles Differ
As the load curve makes clear, the summer and winter demand profiles are meaningfully
different in shape and timing. Evening peak starts earlier in winter, morning peak is
sharper, and solar generation windows are shorter. A system configured for summer
conditions will not behave optimally through winter. Whatever approach is used,
the seasonal difference should be considered — whether through dual seasonal
configurations, a scheduled review, or a platform that adapts automatically.
The Bigger Picture
South Africa has approximately 5 GW of embedded rooftop solar installed,
growing by over 1 GW per year. The midday dip now visible in the national load curve is
direct evidence that the installed base is having a measurable effect on grid demand.
That is a meaningful achievement.
But the morning and evening peaks — the two moments of greatest daily grid stress — remain
almost entirely served by Eskom’s conventional generation fleet. At 18:00 on a winter
weekday, the grid is carrying 29+ GW. The sun is down. Solar contributes nothing. At 07:00
the following morning, demand is surging toward 26 GW and most battery systems are still
recovering from the night.
The hardware to change this is already installed on rooftops across the country. The potential
is tens of gigawatt-hours of active daily dispatch capacity sitting in residential batteries,
cycling once a day at best, configured to serve the client’s convenience rather than the
grid’s need.
The gap is not hardware. It is not cost. It is configuration knowledge and the professional
standard to apply it on every job. That is entirely within the control of the installer.
What Flattening the Curve Actually Means
A flatter load curve means less strain on generation and transmission infrastructure,
fewer emergency generation events, a more stable grid frequency, and a lower average
cost of electricity production for everyone. For your clients it means genuine energy
independence at the moments that matter — morning and evening, every day, not just
during load shedding. For the industry it means installations that can be pointed to
as a demonstrated contribution to grid stability rather than a rooftop accessory
that happens to reduce one person’s electricity bill.
Summary of Principles — Not a Prescriptive Checklist
The following summarises the intent behind each phase of the dispatch approach described
above. How each is achieved depends on the inverter platform, site conditions, and
available controls. The goal in each case is clearly stated; the method is for the
installer to determine.
◎ Overnight: charge battery to ~95% using slow grid draw during low-demand hours
◎ Morning peak: battery as primary source; minimise grid draw; hold 40% reserve
◎ Early solar: serve loads from PV directly; defer bulk battery charging
◎ Midday solar: charge battery to ~95% before exporting surplus
◎ Pre-evening: battery fully charged and held in reserve
◎ Evening peak: battery as primary source; suppress grid draw; hold 40% reserve
◎ Large loads (geyser, pool): scheduled outside both peak discharge windows
◎ Seasonal difference: addressed — whether through dual configs or platform adaptation
◎ All of the above regardless of tariff structure
The panels are the easy part. Anyone can put panels on a roof. The value you add as an
installer is in the intelligence of what sits behind them — a dispatch strategy that puts
stored energy into the grid at the moments of greatest need, twice a day, every day,
summer and winter.
A battery configured for active full-day dispatch is doing its job. Everything else is
leaving the work half done.
Leaving a charger plugged in when not in use can be dangerous because it can overheat and potentially cause a fire. While it’s fine to leave a charger plugged in for a short period, it’s best to unplug it when not in use to reduce the risk of fire.
First of all you will need to directly ask your electrician if he/she is a registered master or installation electrician and for their registration numbers for themselves and their business.
To verify the above, you can:
Visit the website of the Electrical Conformance Board of South Africa (ECBSA) – https://electrician.org.za/ – and search for your electrician there. The ECB SA is the official regulatory body for electricians in South Africa.
Enter the necessary details to perform the search. This may include the electrician’s name, registration number, or other identifying information.
VERY NB: It is always best practice to confirm your search results from official sources and verify the information provided via the phone numbers for the two associations or via email.
Contact Details:
ECB NATIONAL OFFICE | Telephone: (012) 751 2290 | E-Mail: info@ecb.org.za | PO Box 912479, Silverton, Pretoria, 0127
ECA SA Physical Address: ECA(SA) House, 91 Newton Road, Meadowdale Ext.2, Germiston, 1401 | Postal Address: PO Box 9683, Edenglen, 1613 | Telephone: (011) 392 0000 | Fax: (011) 974 9402 | Email: info@ecasa.co.za
The Contact details for ECA SA regional offices in Johannesburg, Pretoria, Durban, Bloemfontein, Gqeberha, Cape Town and East London are to be found on the ECA SA web site under Contact Details.
Quote the relevant numbers from your CoC such as CoC number, electrican and conmpany name and registration numbers given.
A CoC is a certificate issued by a qualified and registered master or installation electrician that Certifies that an installation is in compliance and in accordance with Regulation 7(1) of the Electrical Installation Regulations, 2009 at the time of the inspection.
CoC’s are issued under the aegis of the Department of Labour Occupational Health and Safety Act, 1993.
Sample Header of an Electrical Certificate of Compliance.
The pride of doing simple tasks at home and not having to call a professional – like Straton Electrical – to do it is something that is pretty fulfilling. When it comes to electrical work the scope of work that can be done by a DIY person is limited mostly to non life threatening tasks such as changing a plug top, lightbulb, geyser element and troubleshooting why certain parts of the home have no power.
Here are some short instructional guidelines on how to wire a plug, wire a light switch, change a light bulb, change a geyser element, troubleshoot electrical problems around the home and how to diagnose a continual Earth Leakage Unit tripping problem:
How to Wire a Plug:
Gather the necessary tools: a screwdriver, wire cutters/strippers, and a new plug.
Remove the cover of the plug by loosening the screws.
Strip the insulation off the end of the wire, exposing about half an inch of copper.
Loosen the screws on the plug terminals.
Connect the coloured wire to the corresponding terminal (usually red to live, black to neutral, and green/yellow to earth).
Tighten the screws securely to ensure a proper connection.
Replace the cover and tighten the screws.
Double-check all connections and test the plug before using it.
How to Wire a Light Switch:
Before starting, switch off the power to the circuit at the main electrical panel.
Remove the existing switch cover plate and unscrew the switch from the electrical box.
Locate the wires connected to the switch: typically, a red (live) wire, a black (neutral) wire, and a ground wire.
Disconnect the wires from the old switch, making sure to note their positions.
Connect the corresponding wires to the new switch, using wire nuts or the appropriate connectors.
Carefully tuck the wires back into the electrical box, ensuring they are not pinched or damaged.
Securely screw the new switch into place and replace the cover plate.
Turn on the power and test the switch to ensure it is working correctly.
How to Change a Light Bulb:
Ensure the light switch is turned off before replacing the bulb.
Allow the old bulb to cool down if it was recently in use.
Gently twist the old bulb counterclockwise to remove it from the socket.
Take the new bulb and align the base with the socket.
Insert the bulb into the socket and twist it clockwise until it is snug.
Avoid touching the glass part of the bulb with bare hands to prevent oil transfer, which can shorten its lifespan.
Turn on the light switch to test the new bulb.
How to Change a Geyser Element:
Switch off the power to the geyser at the main electrical panel.
Turn off the tap supplying wtare to the Geyser.
Open the hot water tap in your bathroom to drain the geyser.
Locate the access panel on the geyser, usually found near the bottom.
Remove the access panel using a screwdriver or the appropriate tool.
Identify the heating element, which is a long tube-shaped component.
Disconnect the wires from the element by unscrewing the terminals.
Unscrew the old element using a wrench or the appropriate tool (newer elements use Allen Keys), turning it counterclockwise.
Insert the new element and tighten it clockwise.
Reconnect the wires to the new element, ensuring a secure connection.
Replace the access panel and tighten the screws.
Open the tap and fill the geyser with water.
Turn on the power and test the geyser to verify proper functioning.
How to Troubleshoot Electrical Problems around the Home:
If you encounter no electricity in your home, start by checking the load shedding schedules.
Check that the main municipal Circuit Breaker supplying power to your home is is in the “on” position.
Check that your meter is ‘consuming’ electricity.
Check the circuit breakers in your distribution board to ensure all switches are in the “on” position or fuses are intact.
If a specific area of your home has lost power, check if any circuit breakers have tripped and reset them if necessary.
Inspect outlets or switches for loose connections or signs of damage. If found, switch off the power and consult a licensed electrician for repairs.
If a light fixture is not working, check the bulb to ensure it’s not burnt out. If the bulb is fine, switch off the power and examine the wiring connections within the fixture.
For persistent electrical issues or if you are unsure about troubleshooting, it’s always best to consult a qualified electrician for assistance.
Diagnosing a continual Earth Leakage Tripping problem can be challenging, but here are some steps you can follow to identify and troubleshoot the issue:
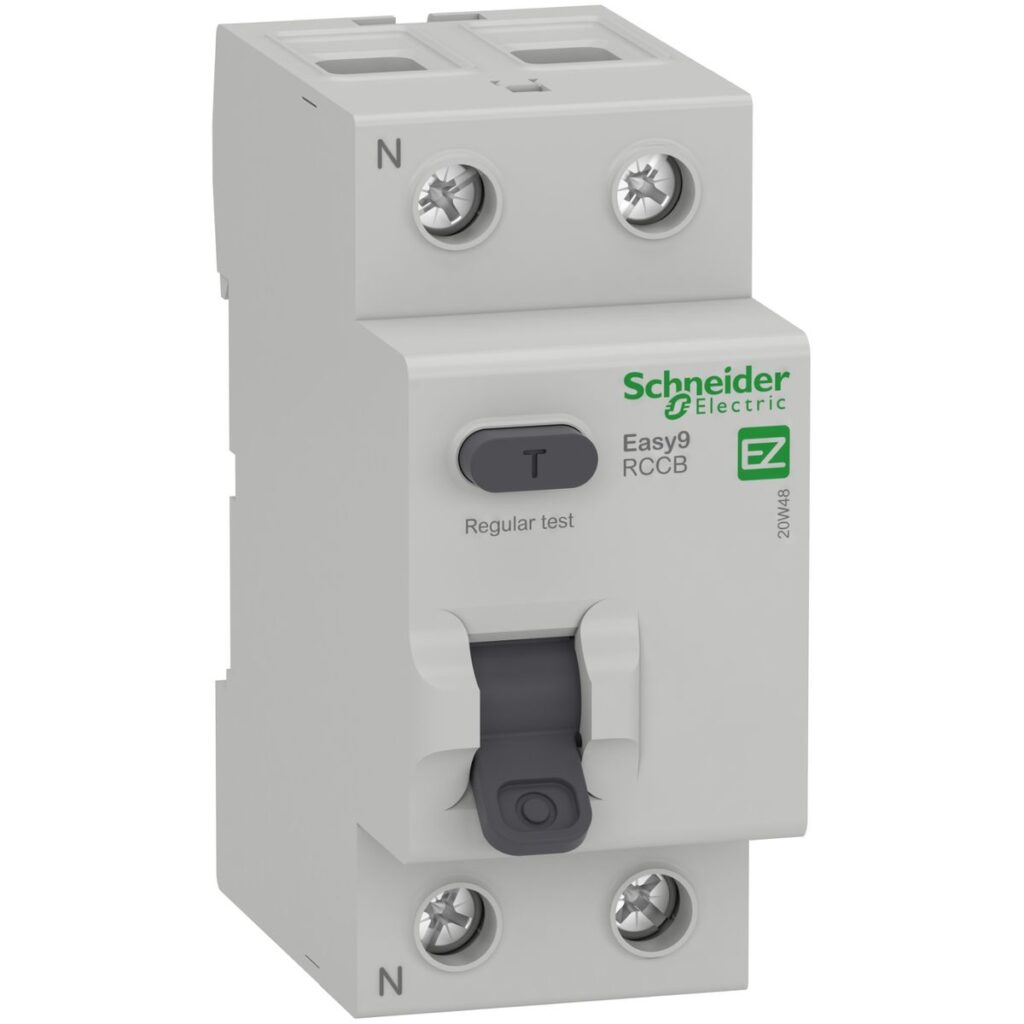
Schneider ELU With Test Button
Understand Earth Leakage Tripping:
Earth Leakage Tripping occurs when an electrical circuit detects an imbalance between the current flowing into the circuit and the current returning through the neutral wire.
This imbalance can be caused by a fault, such as a short circuit or a leakage of current to the earth.
An Earth Leakage Unit (ELU) must function properly in order to protect you from being shocked and possible being killed.
Test your ELU often – press the TEST button on the ELU to check that it does trip. If it doesn’t trip then call an electrician immediately to have it replaced.
Initial Precautions:
Before starting any troubleshooting, ensure your safety by switching off the power to the affected circuit at the main electrical panel.
Use appropriate personal protective equipment (PPE) such as insulated gloves and safety glasses when working with electrical components.
Identify the Circuit:
Determine which specific circuit is causing the Earth Leakage Tripping. This can be done by switching off all individual circuit breakers and then switching them on one by one, observing which circuit triggers the tripping.
Check Appliances and Devices:
Disconnect all devices and appliances connected to the circuit causing the tripping.
Gradually reconnect each device one by one and observe if the Earth Leakage Tripping occurs when a specific device is connected.
If the tripping only happens with a particular device, it may indicate a fault within that device. You may need to have it repaired or replaced.
Inspect Wiring and Outlets:
Carefully examine the wiring and outlets associated with the circuit.
Look for any signs of damage, loose connections, or exposed wires.
Tighten any loose connections and repair or replace any damaged wiring or outlets.
Moisture and Water Intrusion:
Moisture and water can cause Earth Leakage Tripping. Check for any signs of water ingress near electrical components, outlets, or wiring.
In a household the appliances combining electricity and water are normally the first ones to cause a problem – fridegs, freezers, washing machines, kettles being the foremost.
Ensure that all outdoor circuits, such as those for swimming pools or garden areas, are properly grounded and protected against moisture.
Consult a Professional Electrician:
If you have followed the above steps and are still unable to identify the cause of the Earth Leakage Tripping, it is advisable to consult a professional electrician.
A licensed electrician will have the expertise and specialized equipment to diagnose and resolve complex electrical issues safely.
Remember, electrical work can be dangerous, so if you are unsure or uncomfortable with any of these tasks, it’s always best to hire a professional electrician for help.
“When employing an electrician to do work that requires adding to your installtion make sure that your chosen professional is a Registered Master or Installation Electrician and, preferably, is also a member of an electrical contractors voluntary association like the Electrical Contractors Association of South Africa (ECA SA). The ECA has a search facility on their web site listing all members. With the ECA you get peace of mind and the comfort knowng that you have a third party to report any concerns or bad workmanship to,” says Straton Electrical.
World Water Monitoring Day (WWMD) is celebrated on 18 September each year.
The South African Department of Water and Sanitation, under the slogan; “Enhancing accountability and sustainability for every drop!” says that World Water Monitoring Day is an international education and outreach program that builds public awareness of the importance of protecting water resources around the world by engaging with people to conduct basic monitoring of their local water bodies.
Straton Water Monitors say; “Along with monitoring and management of our water resources we would say that measurement of our water usage is the first step and of paramount importance as, simply, if you cannot measure you cannot manage or monitor!”
The addition of a simple IoT Water Monitor device from Straton Water Monitor will certainly assist you in the above with management at your fingertips via an Android App or online.
If you take these three facts into consideration: (1) Household leaks can waste more than 3.8 trillion liters annually nationwide. That’s equal to the annual household water use of more than 11 million homes. (2) Ten percent of homes have leaks that waste 340 liters or more per day and (3) A leaky faucet that drips at the rate of one drip per second can waste more than 11 400 liters per year – then it will become clear that managing water properly can lead to massive savings – not only of water but also of money leaking back down the drain!
Straton Water Monitor IoT Device
The Straton Water Monitor is the first step in takling back control. This IoT Device simply plugs into the ‘probe hole’ on most meters, is self powered and communicates to any IoT enabled ‘tower’ as it communicates your water usage to an Android App or online browser. Exceptions are reported and leaks can be diagnosed long before they become a major problem.
“Our first installation of the Straton Water Monitor was in a self owned rental premises currently being used as a private school. On the first weekend after installation we were alerted to high water usage from what should have been an unoccupied building. Immediate investigation revealed a leaking toilet cistern that, if left unattended to, would have led to the loss of tens of thousands of liters of water which we would have paid hundreds of rands to the local municipality for,” says Straton.
World Water Monitoring Day is officially celebrated on September 18 annually, but monitoring and educational events can take place any time between March 22 and December 31 annually. During this time, people of all ages throughout the world community have an opportunity to monitor the quality of their local watersheds and enter the results of their efforts into an international database. Water boards and stakeholders also use this period to educate and create awareness on natural water resource monitoring targeting professionals and managers in the sector, across different disciplines and end users.
The SA Government Department’s Surface and Groundwater directorate (SGWI) engages in a wide variety of data collection and analysis activities such as specialised springs, transboundary aquifer and Acid Mine Drainage monitoring, surface and groundwater quality and level monitoring including rainfall station, in support of the public’s needs and in support of decision making processes. This is in line with adhering to the South African National Water Act (NWA, 36 of 1998) to protect and ensure all natural water resources are used and managed sustainably, and the public has reliable, affordable, accessible and good quality water on daily basis for domestic and economic use.
Monitoring these water resources and ensuring environmental sustainability further contributes towards the progress of achieving SDG goal(s) namely Clean Water and Sanitation (SDG 6);
Target 6.3: By 2030, improve water quality by reducing pollution, eliminating dumping and minimizing release of hazardous chemicals and materials, halving the proportion of untreated wastewater and substantially increasing recycling and safe reuse globally
Target 6.5: By 2030, implement integrated water resources management at all levels, including through transboundary cooperation as appropriate
Target 6.6: By 2020, protect and restore water-related ecosystems, including mountains, forests, wetlands, rivers, aquifers and lakes
WWMD activities are aligned with ensuring progress towards Target 6.B: Support and strengthen the participation of local communities in improving water and sanitation management
World Water Monitoring Day was established in 2003 by America’s Clean Water Foundation (ACWF) as a global educational outreach program. The program, subsequently named the “World Water Monitoring Challenge” and “EarthEcho Water Challenge,” aims to build public awareness and involvement in protecting water resources around the world by empowering citizens to carry out basic monitoring of their local water bodies. Roberta (Robbi) Savage, ACWF’s president and CEO created WWMD, and Edward Moyer was the first WWMD Coordinator.
A simple test kit enables everyone, children and adults, to sample local water bodies for a set of water quality parameters including temperature, acidity (pH), clarity (turbidity) and dissolved oxygen (DO). Information on purchasing low-cost test kits is available from the current sponsoring organization, EarthEcho International, and the results of monitoring events are then shared with participating communities around the globe on the sponsor’s website.
In South Africa:
School-aged girls spend several hours a day trekking to and from deep water boreholes (wells).
Women often walk 10-15 kilometers per day to carry 15 liters on their heads for the long trek home.
Typically, 15 liters of water typically lasts a family for only a day or two.
Here is why we need to conserve water:
Earths water supply is limited – we only have the water that we have now
97 Percent of all the water on the earth is salt water and hence, it is not suitable for drinking
Out of the three percent fresh water, only one percent is available for drinking
The other two percent is sealed in glaciers
Every one of us relies on that one percent water for survival, so it should be one of our responsibilities to preserve and conserve water
Saving water helps in preserving our environment. It reduces the energy required to process and deliver water, which helps in reducing pollution and in conserving fuel resources
Saving water will make water available in the future
It helps in building a better defence against future drought years
We use water for many other and important reasons like making electricity, cleaning, cooking, irrigating, etc
We need to conserve water so that our trees and plants can have life
It is also needed for the survival of some endangered species.
The water amount stays the same: Because of its cyclical nature, the amount of water that has ever been present on earth has remained the same since the beginning of time.
Water is a sign of life: If scientists wish to search for life in dark unexplored corners of the earth or space, they will look for water as all the species known to humankind are dependent on water in one way or another.
Water is good for temperature regulation: Your body’s temperature as well as the earth’s temperature is regulated by water.
Water defies gravity: Unlike many other liquids, water can defy gravity, and a prime example of this is how water travels up a plant’s roots and through its inner vessels.
Water is Life – More Reasons Why:
Read on to find out why you could be drinking water that once passed though a dinosaur!
The freezing point of water lowers as the amount of salt dissolved in at increases. With average levels of salt, seawater freezes at -2 °C (28.4 °F).
About 6,800 gallons of water is required to grow a day’s food for a family of four.
To create one pint of beer it takes 20 gallons of water.
780 million people lack access to an improved water source.
In just one day, 200 million work hours are consumed by women collecting water for their families.
1/3 what the world spends on bottled water in one year could pay for projects providing water to everyone in need.
Unsafe water kills 200 children every hour.
It takes 454 liters of water for one egg.
A jellyfish and a cucumber are each 95% water.
70% of the human brain is water.
80% of all illness in the developing world is water related.
Up to 50% of water is lost through leaks in cities in the developing world.
In Nairobi urban poor pay 10 times more for water than in New York.
In some countries, less than half the population has access to clean water.
$260 billion is the estimated annual economic loss from poor water and sanitation in developing countries.
40 billion hours are spent collecting water in Africa alone.
A person can live about a month without food, but only about a week without water.
Water expands by 9% when it freezes.
There is about the same amount of water on Earth now as there was millions of years ago.
85% of the world population lives in the driest half of the planet.
Agriculture accounts for ~70% of global freshwater withdrawals (up to 90% in some fast-growing economies).
Various estimates indicate that, based on business as usual, ~3.5 planets Earth would be needed to sustain a global population achieving the current lifestyle of the average European or North American.
300 tons of water are required to manufacture 1 ton of steel.
It takes about 145 liters per day to sustain a human (this figure takes into account all uses for water, like drinking, sanitation and food production).
Each day, we also lose a little more than a cup of water (237 ml) when we exhale it.
By 2025, water withdrawals are predicted to increase by 50 percent in developing countries and 18 percent in developed countries.
By 2025 half the world’s people will live in countries with high water stress.
A water-efficient dishwasher uses as little as 15 liters per cycle but hand washing dishes uses 56 liters of water.
The average family of four uses 681 liters of water per day outdoors. It is estimated that over 50% is wasted from evaporation, wind, or overwatering.
It takes more than twice the amount of water to produce coffee than it does tea.
Chicken and goat are the least water intensive meats to consume.
There have been 265 recorded incidences of water conflicts from 3000 BC to 2012.21
Hot water can freeze faster than cold water under some conditions (commonly known as the Mpemba effect).
If the entire world’s water were fit into a 4 liter jug, the fresh water available for us would equal only about one tablespoon.
Over 90% of the world’s supply of fresh water is located in Antarctica.
On average, 38 liters per day of your water footprint (or 14% of your indoor use) is lost to leaks.
The average pool takes 83 000 liters of water to fill.
It takes about 265 liters of water to fill a bathtub.
Water use has grown at more than twice the rate of population increase in the last century.
Only 0.007 percent of the planet’s water is available to fuel and feed its 6.8 billion people.
A swimming pool naturally loses about 3 785 liters a month to evaporation.
Producing a 3.79 liters of corn ethanol consumes 644 liters of water in total, from irrigation to final processing. On the other hand, the water requirement to make a gallon of regular gasoline is just 19 liters.
40% of freshwater withdrawals in the United States are used for agriculture.
65% of freshwater withdrawals in China are used for agriculture.
Freshwater withdrawals for agriculture exceed 90% in many countries: Cambodia 94%, Pakistan 94%, Vietnam 95%, Madagascar 97%, Iran 92%, Ecuador 92%.29
An acre of corn will give off 15 000 liters of water per day in evaporation.
In a 100-year period, a water molecule spends 98 years in the ocean, 20 months as ice, about 2 weeks in lakes and rivers, and less than a week in the atmosphere.
Water is the most common substance found on earth.
Water makes up about 66 percent of the human body.
There are no scientific studies that support the recommendation to drink 8 glasses of water per day.
Drinking too much water can be fatal (known as water intoxication).
There is more fresh water in the atmosphere than in all of the rivers on the planet combined.
If all of the water vapor in the Earth’s atmosphere fell at once, distributed evenly, it would only cover the earth with about an inch of water.
263 rivers either cross or demarcate international political boundaries.
Of the estimated 1.4 billion hectares of crop land worldwide, around 80 percent is rainfed and accounts for about 60 percent of global agricultural output (the other 40% of output is from irrigated crop land).
Each cubic foot of Martian soil contains around two pints of liquid water, though the molecules are not freely accessible, but rather bound to other minerals in the soil.
There is an estimated 1234 million trillion gallons of water on earth.
NASA has discovered water in the form of ice on the moon.
A 2.6 billion year old pocket of water was discovered in a mine, 2 miles below the earth’s surface.
Two-thirds of the world’s population is projected to face water scarcity by 2025, according to the United Nations.
1 kilogram of beef requires 15 000 liters of water.
1 kilogram of wine requires 8 400 liters of water.
A 14o gram burger requires 5 500 liters of water.
1 slice of bread requires 41.6 liters of water.
1 apple requires 68 liters of water.
1 pound of chocolate requires 26 500 liters of water.43
500 sheets of paper requires 11 000 liters of water.
Ground water occurs almost everywhere beneath the land surface. The widespread occurrence of potable ground water is the reason that it is used as a source of water supply by about one-half the population of the United States.
Hydrologists estimate, according to the National Geographic Society, U.S. groundwater reserves to be at least 33,000 trillion gallons — equal to the amount discharged into the Gulf of Mexico by the Mississippi River in the past 200 years.
At any given moment, groundwater is 20 to 30 times greater than the amount in all the lakes, streams, and rivers of the United States.
About 27 trillion gallons of groundwater are withdrawn for use in the U.S. each year.
Loadshedding has become South Africa’s Number One ‘Sport’ as various Ministers and a parade of CEO’s peddle the latest quick fix solution.
Many of us cannot afford a decent Solar System to keep the lights on and have developed our own coping mechanisms to make loadshedding just that tiny bit more palatable.
Here are 15 tips to help you survive load shedding risks, without the need of a generator or solar panels:
Know your schedule: Make sure that you keep track of any scheduled outages in your area by downloading a reputable Eskom load shedding app on your smartphone. Alternatively, ask to be added to a group of friends who can keep one another updated on planned load shedding schedules.
Be security savvy: The sad reality is that criminals also study load shedding schedules to identify which areas will be vulnerable at specific times. Tripped and false alarms are great opportunities for opportunistic burglars. Be extra vigilant about access to your home and securing your perimeter.
Get back-up batteries for your alarm and gate system: Ensure that your alarm system is in a working condition and the back-up battery is fully functional to provide power to the system in the event of load shedding. Similarly, check that your garage door motor or electronic gate can function without power.
Make sure you have sufficient back-up lighting: Keep a torch or headlamp in your car if you arrive home at night during a power outage. Most smartphones have built-in torches or torch apps which come in handy during unexpected power outages – which bring us to the next point…
Always stay charged: Ensure your cellphone, laptop and tablet devices are fully charged ahead of scheduled blackouts. Be sure to charge them again as soon as possible after the power returns. It’s also a good idea to have an emergency phone charger and power bank close by. This comes in handy during extended power outages.
Plan to stay connected: Staying connected to the internet is a great way to keep in touch with what’s happening as well as for regular updates, so ensure that your mobile data stays topped up. Remember to use devices sparingly during outages so that you don’t drain the battery completely before the power returns.
Don’t forget the benefits of gas: Invest in a small gas bottle and lamp to for cooking and lighting. A gas lamp provides good quality lighting for a large area and a gas cooker can be a life saver during electricity cuts. It’s a good idea to keep hot water in a thermal flask so that you can make hot drinks. Prepare meals beforehand if you know there’s going to be a scheduled blackout during meal times.
Stock up on bottled water and pop some in the freezer: Some households depend on electric pumps for their water supply, especially in rural areas. Frozen bottled water will help keep food cold during a power outage and will also not spoil. Having a few extra bottles handy will ensure you won’t run out during outages.
Keep the cold in: Leave your freezer and refrigerator doors closed as much as possible to preserve the temperatures inside. Did you know that a fully stocked freezer should keep food safe for up to two days and a refrigerator for four to six hours?
Unplug your cables as soon as the power goes out: Consider any electrical connection as live during a power outage as power can return at any time. Unplug any electronic devices or equipment or switch it off at the wall, including fixed telephone cables. This will help prevent damage or injury due to surges that may occur when electricity is restored.
Back up your data: If you save important data on our home computer, consider backing it up over the internet in case of a hard drive crash or unforeseen electrical fault. Online cloud-based backups are very convenient and are mostly automated, which means that you have one less thing to worry about.
Know your emergency contacts: Save emergency contact information on your phone but also keep a printed copy close by. This should include emergency services such as the fire department, police and medical services. Also include contact information of friends and family along with your insurance information.
Buy perishables in smaller amounts: With longer and more frequent blackouts, perishables like vegetables are more likely to spoil. So, shop sparingly. While your fridge/freezer can preserve food for a few hours without power, the higher stages may not give the system enough time to reach optimal temperatures. While we often advise buying in bulk to save, in this case, less is definitely more.
Plan tasks around the schedule: Cook when you can so you don’t spend money on takeaways or going out. Time your laundry so you don’t end up with a half-washed load that needs to be rewashed when the power comes back. All these little expenses add up.
Gather the family together: Instead of having each family member squirrelled away in their own room, gather everyone together. You’ll be using fewer lights and spending more quality time together.
Electric surges are one of the biggest causes of damage to your household equipment during a power outage. Installing a surge protection device can help minimise some damage in unforeseen situations. Have a surge protection device fitted to your electrical distribution board or at the power outlets to electronic devices. Contact a profession electrical contractor to discuss the process and costs involved.
Saving electricity leads to longer lasting appliances and less load on your electrical installation. In the long run this will save you lots of money. Eskom has shared these tips that every household can use to save energy and money:
Geysers
1. Set your electrical geyser’s thermostat at 55 ° C to 60 ° C. To save energy, make sure the geyser and all hot water steel pipes in the roof are well insulated with fibreglass or newspaper.
2. Solar heating units could reduce the geyser’s electricity consumption by 40% to 50%. This would result in a savings of about 200kWh to 250kWh of electricity per month, depending on the number of geysers and the size of the family.
Lights
3. Switch off the lights when they are not needed.
4. Use fewer bulbs with higher wattages. For instance, one 100 watt bulb produces the same light as two 60 watt bulbs.
Use the correct heaters. Infrared electricity heaters are the most energy efficient heaters available while oil heaters are the safest.
6. Use compact fluorescent lamps (CFL) instead of ordinary bulbs.
7. Use low-energy lamps for exterior lighting.
Heating
8. Use the correct heaters. Infrared electricity heaters are the most energy efficient heaters available while oil heaters are the safest.
9. Insulate the ceiling and seal air gaps in the home.
10. Ensure that heaters have thermostats.
11. Use electric blankets but turn them off when in bed.
Dishwasher
12. Fill the dishwasher completely before operating it.
13. Turn off the dishwasher before the drying cycle so that you can wipe the dishes clean with a dry cloth.
14. Connect the dishwasher to the cold water supply.
15. Clean filters.
16 When buying a dishwasher, look for energy saving features like a short wash cycle.
Install your dishwasher away from your refrigerator. The dishwasher’s heat and moisture make the refrigerator work harder.
17. Install your dishwasher away from your refrigerator. The dishwasher’s heat and moisture make the refrigerator work harder.
Tumble Dryers
18. Tumble dryers that operate with an electronic humidity control are the most efficient as they automatically shut off the drying cycle when clothes are dry.
19. Use correct temperature settings to minimise the amount of electricity used.
20. Remove water before putting clothes into the tumble dryer.
21. On sunny days, take the opportunity to dry your clothes outside.
Automatic washing machines
22. A front loading washing machine uses less water and costs less to operate.
232. Use the warm water setting to cut down on electricity needed to heat the water.
24. Make sure you have a full load before washing.
25. Select the shortest possible washing programme.
Keep oven doors closed until food is cooked.
26. Cold water detergents reduce electricity consumption.
Stoves
27. Use pressure cookers when preparing food that takes a long time to cook.
28. Match pots and pans to stove plates. Small pots on large plates waste electricity.
29. Do not use pots with distorted bottoms.
30. Switch off the plates or oven before food is fully cooked. This allows you to finish your cooking without using energy.
31. Keep oven doors closed until food is cooked.
32. Do not preheat the oven. It isn’t necessary to preheat the oven except for food requiring high temperatures and slow cooking times.
33. Make use of the oven’s leftover heat. Your oven retains heat for 15 to 30 minutes after it is turned off. Use that free heat to warm up desserts, rolls or freshen crackers and cookies.
34. Glass and ceramic pans retain heat better than metal pans.
Don’t open the fridge door unnecessarily and make sure the seal is intact.
35. Use the self-cleaning feature only when it’s necessary. Start the self-cleaning cycle right after cooking while the oven is still hot. Less energy will be required to reach cleaning temperature.
Microwave Ovens
36. When you defrost food, leave it in the fridge overnight. You’ll use less electricity than defrosting food in the microwave.
37. Use the microwave to cook small to medium quantities of food. For larger portions of meat, it’s better to use a conventional oven or pressure cooker.
Refrigerator
38. Don’t open the door unnecessarily and make sure the seal is intact.
39. Turn off an empty refrigerator when going on holiday.
40. Let hot foods cool down before placing them in the refrigerator.
41. Defrost fridges regularly. A build-up of ice reduces operating efficiency and increases running costs.
Freezers
42. Defrost the freezer regularly. Freezers work harder to remove heat and have to use more power. Only 90% of a freezer’s capacity should be used for freezing.
General
43. Do not buy larger or more powerful appliances than are actually required.
44. Do not buy an electric appliance when a hand-operated one will suffice.
45. Use the correct appliance for the job e.g. do not make toast on the stove or in the oven.
46. Do not fill a kettle if only a small quantity of boiling water is required. It is sufficient to put in only enough water to cover the element.
47. It is more economical to boil water in a kettle rather than in a pot on the stove.
48. Always use an iron that is thermostatically controlled. You can avoid ironing clothes by removing clothing promptly from tumble dryer and folding them carefully.
49. Operate swimming pool filter pumps for minimum periods.
50. Paint the walls of your home in a light colour. Dark colours tend to absorb light, requiring you to use more energy from light bulbs to achieve the same effect.
In the realm of electrical systems, distribution boards play a vital and often under-appreciated role. Serving as the hub for electrical distribution within a building or structure, these boards ensure that power is safely and efficiently allocated to various circuits. This article delves into the concept of electrical distribution boards, exploring their essential functions, the different types available, and the considerations involved in their selection and installation.
What is a Distribution Board (DB)?
A distribution board, also known as a breaker panel or electrical panel, is a critical component in an electrical system. Its primary function is to distribute electrical power to different parts of a building through individual circuits.
Basic Function and Components: A distribution board consists of main components such as circuit breakers, fuses, and switches. These elements work together to regulate the flow of electricity, providing protection against overloads and short circuits that could lead to electrical fires or equipment damage.
Location and Installation: Typically installed near the point where the main power supply enters a building, distribution boards are carefully designed and placed to provide easy access for maintenance and monitoring. Their connection to the main power supply ensures a seamless distribution of electricity throughout the premises.
Safety Considerations: Safety is paramount when dealing with electricity, and distribution boards are no exception. They must comply with specific electrical codes and standards, providing essential protection for both people and property.
Types of Electrical Distribution Boards
There are several types of distribution boards, each designed to meet specific needs and applications:
Single-Phase Distribution Boards: Commonly used in residential buildings, single-phase distribution boards handle the distribution of single-phase electricity. They are suitable for powering standard household appliances and lighting.
Three-Phase Distribution Boards: Designed for industrial settings or commercial buildings with higher power requirements, three-phase distribution boards manage the distribution of three-phase electricity. They are essential for powering heavy machinery and large electrical loads.
Sub-Distribution Boards: These boards are connected to the main distribution board and are used to further distribute electricity to specific areas within a building. They allow for more localised control and monitoring of electrical circuits.
Specialised Distribution Boards: Certain environments require specialised distribution boards, such as marine or explosion-proof boards. These are designed with unique features to meet specific safety and functional requirements.
Selection and Installation Considerations
Choosing the right distribution board and ensuring proper installation is crucial for the safety and efficiency of an electrical system:
Choosing the Right Type: Assessing the power requirements, environment, and location is essential in selecting the appropriate distribution board. Factors such as the number of circuits, load capacity, and environmental conditions must be considered.
Professional Installation and Maintenance: Installation should always be handled by qualified electricians who understand the intricacies of electrical codes and standards. Regular inspection and maintenance are also vital to ensure ongoing safety and performance.
Distribution boards are foundational to modern electrical systems, providing a structured and safe means of distributing power. From the simple single-phase boards used in homes to the robust three-phase boards in industrial settings, these essential components cater to diverse needs. Understanding the various types and their applications, along with the importance of proper selection, installation, and maintenance, is key to ensuring a safe and efficient electrical system. Whether you’re a homeowner, business owner, or industry professional, a comprehensive understanding of distribution boards empowers you to make informed decisions about your electrical needs. find out more from Electrical Board Manufacturers (PTY) Ltd
Thank you for completing this survey. We will be using your answers to guide us in making a better experience for our local SAIAT Chapter. Completion should take less than 3 minutes.